Other Tabs
Details & Raw
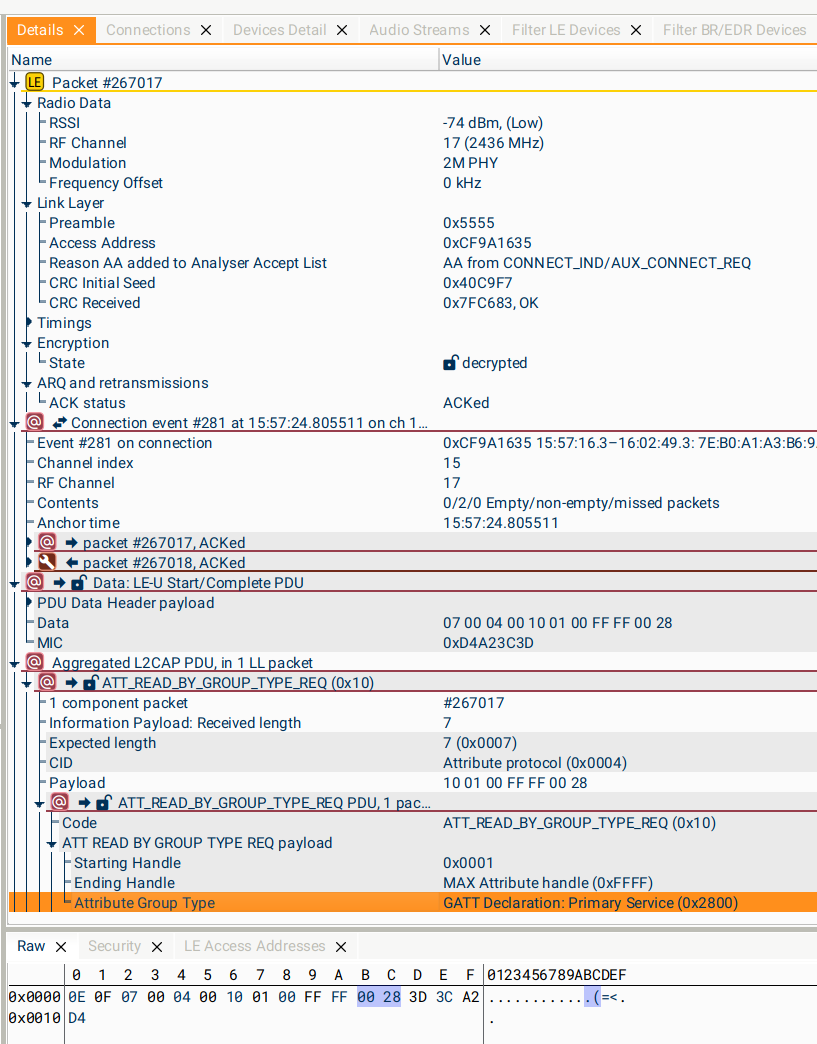
These tabs provide the most detailed look at a packet or higher-layer event. The Details tab is populated whenever an event is selected in the Summary/Timeline/Spectrum tabs, and the Raw tab is also populated when the event has "a payload".
If you want to look at the contents of two or more packets at the same time, you can create multiple Details tabs; you can then click on a packet, pause/freeze the contents of one Details tab, and click on another packet to update the second Details tab. This can be useful to retain a configuration packet/procedure (e.g. an LL_CIS_IND, an ASE CP Config Codec, or a Channel Sounding Start procedure) while looking at the details of individual packets.
In the Details pane, baseband packets display some details about the layer(s) above (e.g. the Connection Event and Control Procedure trees displayed for the LE Link Layer packet selected in the screenshot above), and higher-layer packets display some information about the layer(s) below.
Any highlighted fields in a payload shown in the Details tab correspond to bits or bytes within the Raw data. In the screenshot above, the "Attribute Group Type" field has been selected, and so the corresponding bytes 0x00, 0x28 in the Raw data have been highlighted.
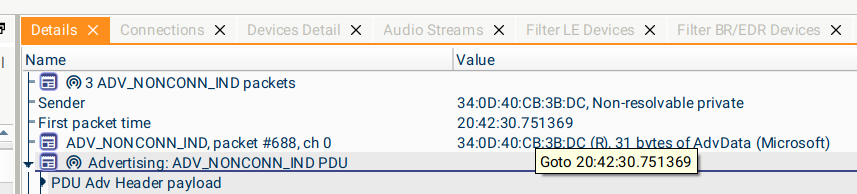
Double-clicking on any field containing a time, or referencing another packet, will jump to that location in the Summary. These fields will display a tooltip showing what time you can jump to. Similar jump-to-time fields are present in the Connections and Devices tabs.
The other fields with coloured backgrounds are section headers, marking different types of information about the packet. The colours used are consistent throughout the application; lighter colours denote baseband packets/information, and darker colours show Connection/Advertising Events, Slot Pairs, and higher protocol PDUs.
Bookmarks
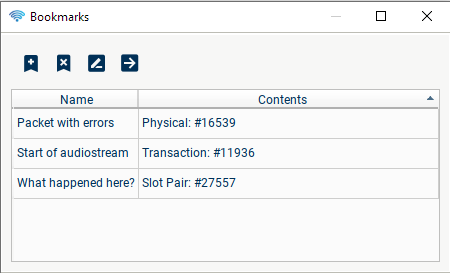
Any packet or larger event can be bookmarked for later study or to send to other users; when you have added bookmarks, make sure to Save to add them to the file!
 {}
{}
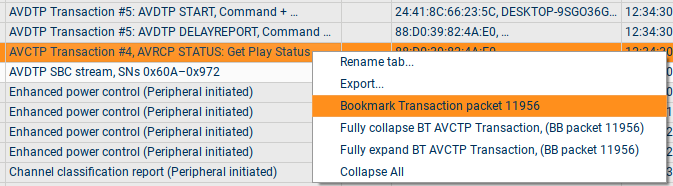
Bookmarks can either be added using the context menu in the Summary tab, or by selecting a packet and pressing  in the Bookmarks tab.
Bookmarks can also be deleted and renamed in this tab; double-clicking on a bookmark, or pressing the
in the Bookmarks tab.
Bookmarks can also be deleted and renamed in this tab; double-clicking on a bookmark, or pressing the  button will jump to that packet in the Summary, if it is visible under the current filtering.
Devices/Connections Details
This tab collects together extra information about the Connections and Devices selected in the filter currently being edited in the Filter Devices tab.
The connections trees show a summary of the Control Procedures/LMP packets sent, and detail of any L2CAP Channels in use. Details of any GATT Characteristics/Services and ATT Transactions seen are also found in the L2CAP Channels subtree.
For an LE Connection, in addition to the above information we collect a list of the Connection Parameters valid at each time during the Connection, including both Parameters transmitted and Parameters we have inferred from an ongoing Connection.
The device trees, in addition to device addresses, collect any other transmitted information including device names, vendors, IRKs, Class of Device, and various types of supported feature.
Each Device tree also includes summaries of the Advertising/Data/Paging/Connected packets sent and received, with links to jump to the first of each of these packet types.
Audio Streams
This tab displays details of the transport configuration (e.g CIS parameters) of any audio-streams we have seen (in contrast to the audio parameters, which are shown in the Audio Export tab).
Security Key Manager
See Decrypting.
LE/QHS Access Addresses
This displays the LE and QHS-LE Access Addresses that we have seen during the capture; each row is a link to jump to the first packet seen on that AA. Only confirmed AAs are displayed here; packets with CRC failures will not cause an AA to be added to the list.
Topology
This shows the current devices, connections and audio-streams in the chosen device filter. You can enable/disable labels on the devices and the streams, and you can choose to show or hide "Inert" devices, i.e. those only advertising/inquiring and not participating in any displayed connections. The colours of the devices and links indicate whether they are communicating using LE, Classic, or both. The icons decorating the links indicate whether any audio is currently being sent, and in which direction.
Packet errors/issues
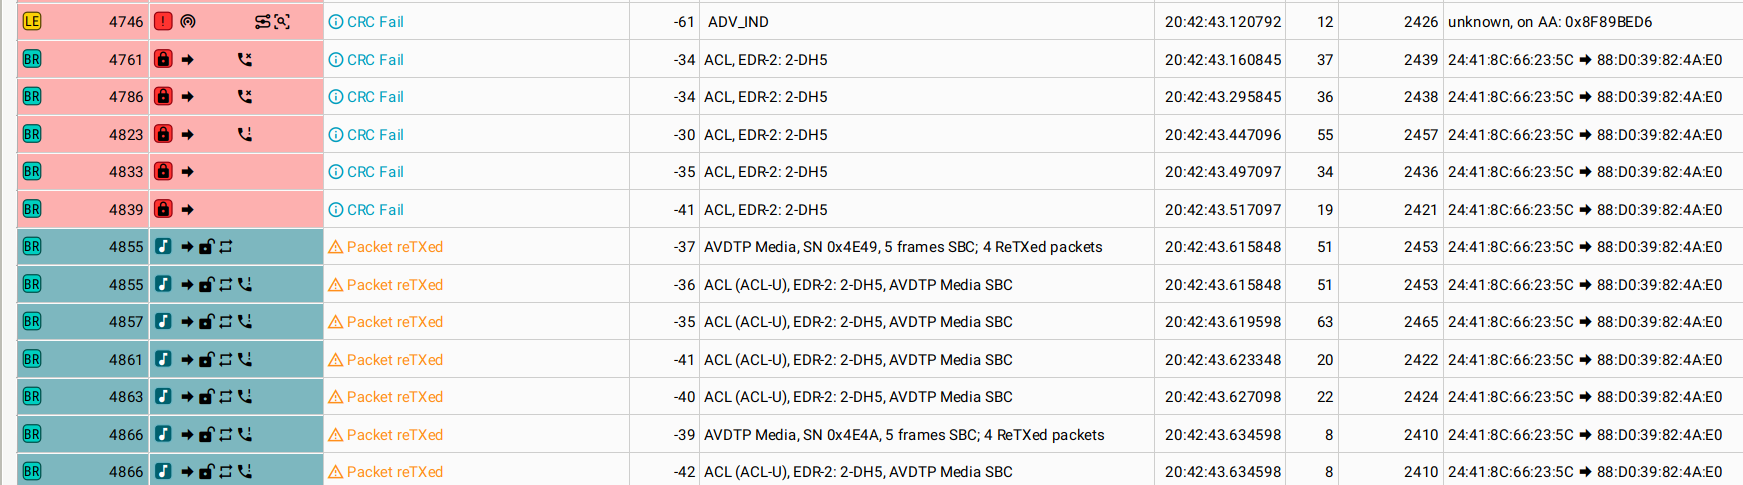
This collects together errors/warnings/informative messages seen during the capture, and allows filtering and sorting them to easily display all the instances of a particular type of issue. The issues displayed include both Bluetooth errors (invalid values, packets with invalid lengths etc), communication impairments (ReTXed packets, rejected packets), receive impairments (CRC fails, MIC fails, missing packets), and analyser difficulties (e.g. protocols not parsed, either due to use of proprietary protocols or features not yet supported).
Double-clicking on a row will navigate to that packet/event in the active Summary tab.
The "Filter Errors" popup can be used to select which errors to display. To select/deselect a whole error level, use the leftmost column; for error categories, the middle column, and for individual errors, the rightmost column.
Exporting Data
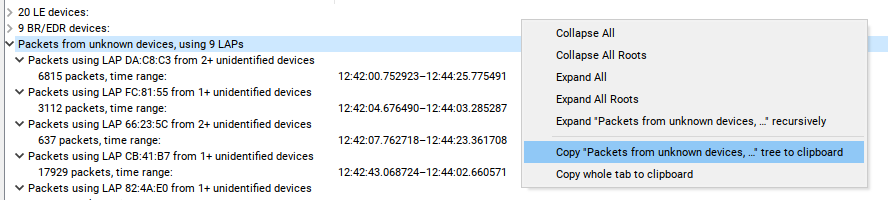
In the Details, Connections, and Devices Detail tabs, the contents of the tabs can be copied to the clipboard for pasting into a text editor or other application. The context menu allows copying either the whole tab, or individual subtrees.
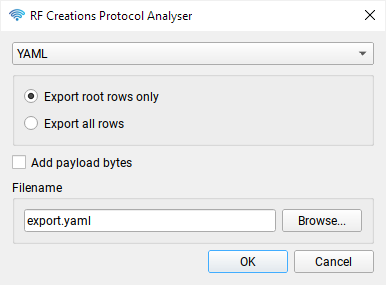
Additionally, the complete contents of a Summary tab can be exported as either a CSV or YAML file using the "Export..." option in the context menu. When using an aggregation level other than "Baseband", you have the option to export only the top-level, root rows. You can also choose to add the complete payload bytes (dewhitened, decrypted etc) to the export.
audiopod & audiopod plots
See audiopod