Summary tab
The Summary tabs are the main interface and control window for the application. By default they display all of the captured packets, aggregated into e.g. GATT Procedures, LE Advertising Events, etc.
Selecting a packet or higher-layer event in the Summary will:
-
display more information about the packet in the Details tab;
-
load the raw bytes into the Raw tab;
-
scroll the Spectrum and Timeline tabs to the correct time, and select the event there unless it is hidden in that view.
Expanding a higher layer event (using the arrow at the left-hand edge) will display the constituent packets from the lower protocol layer.
During Capture, the "Autoscroll" button in the top left of the window causes the view to automatically scroll, displaying the most recently captured packets. "Autoscroll" will be disabled when a packet is selected. Equivalent "Autoscroll" buttons are in the top left of the Spectrum and Timeline tabs, to provide independent control of this feature.

The first row of controls is, from left to right:
- View selector
- GoTo box
- Add/modify columns, and add coloured columns matching some filter.
- Choose which Device Filter to use, or choose no device filtering.
- Complex filter popup
- Search
- Transport filter buttons
Choosing and Creating columns
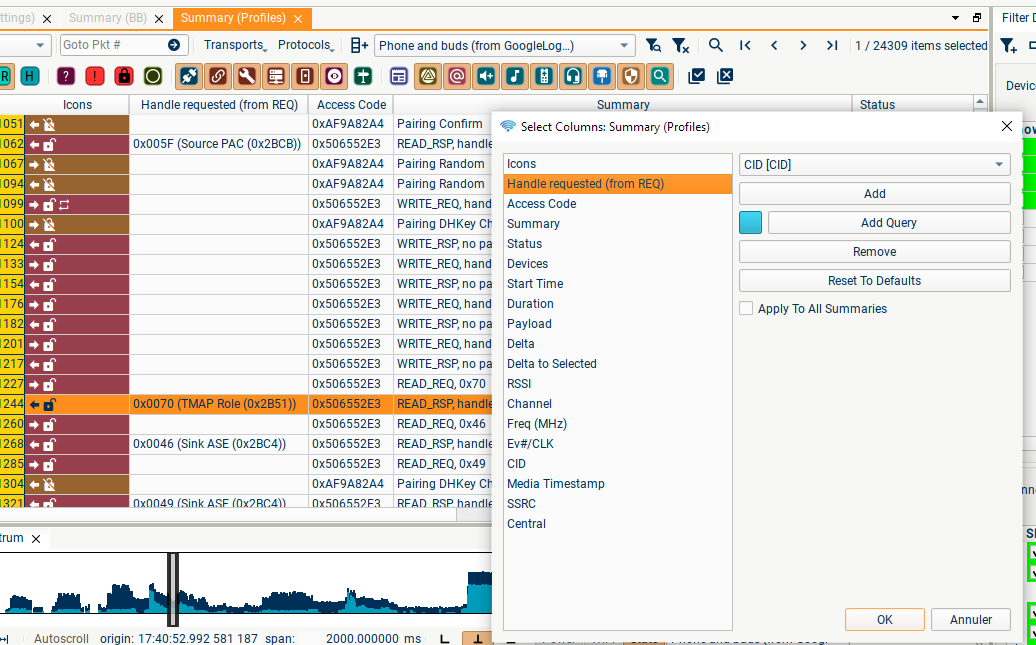
In each Summary tab, you can choose which columns to show, and add new
ones, using the Select Columns dialog (launched using this button
 ).
).
There are three types of columns:
-
Columns using one of the documented queries
-
Columns created by clicking on a non-expandable field in a Details pane and dragging it into a Summary tab. These columns will mostly only show data when an identical field is present in another packet; so in the screenshot a column was created by dragging the "Handle requested" field from a ATT_READ_RSP details pane, and it is only showing information from other READ_RSP packets.
-
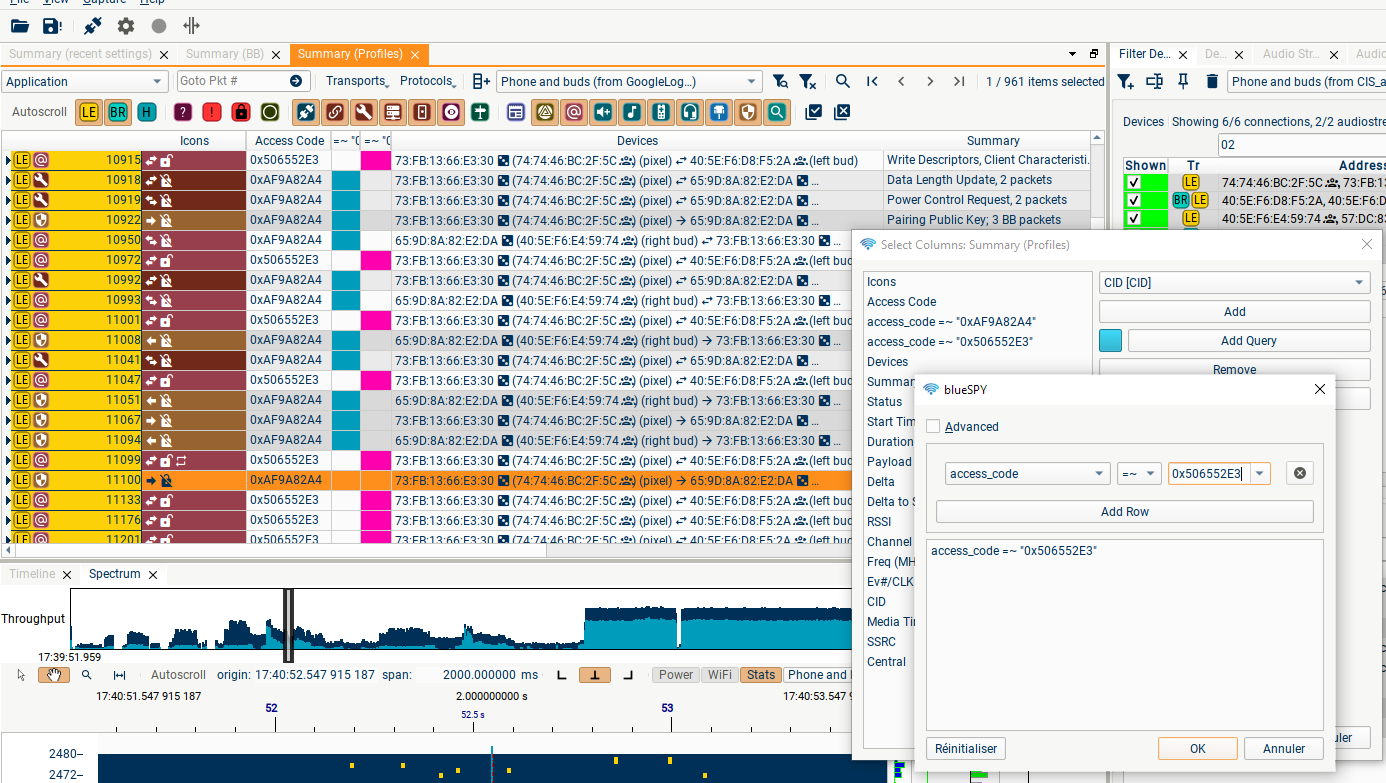
Columns showing a chosen colour when a particular query is true. For instance, when you have two similar connections to two earbuds, you can add a column highlighting which packets/transactions are on which Access Address:
GoTo
If you have previously found a packet of particular interest, you can use the GoTo box to navigate quickly to that packet using its packet number.
Multiple Summary tabs
Using the View menu, you can open extra Summary tabs; the filtering and aggregation options can be selected independently in these tabs, so you can e.g. keep one tab open showing baseband packets with no filtering, and another showing just the protocols you are interested in. These tabs can also be renamed by right-clicking in the tab.
Linked packets
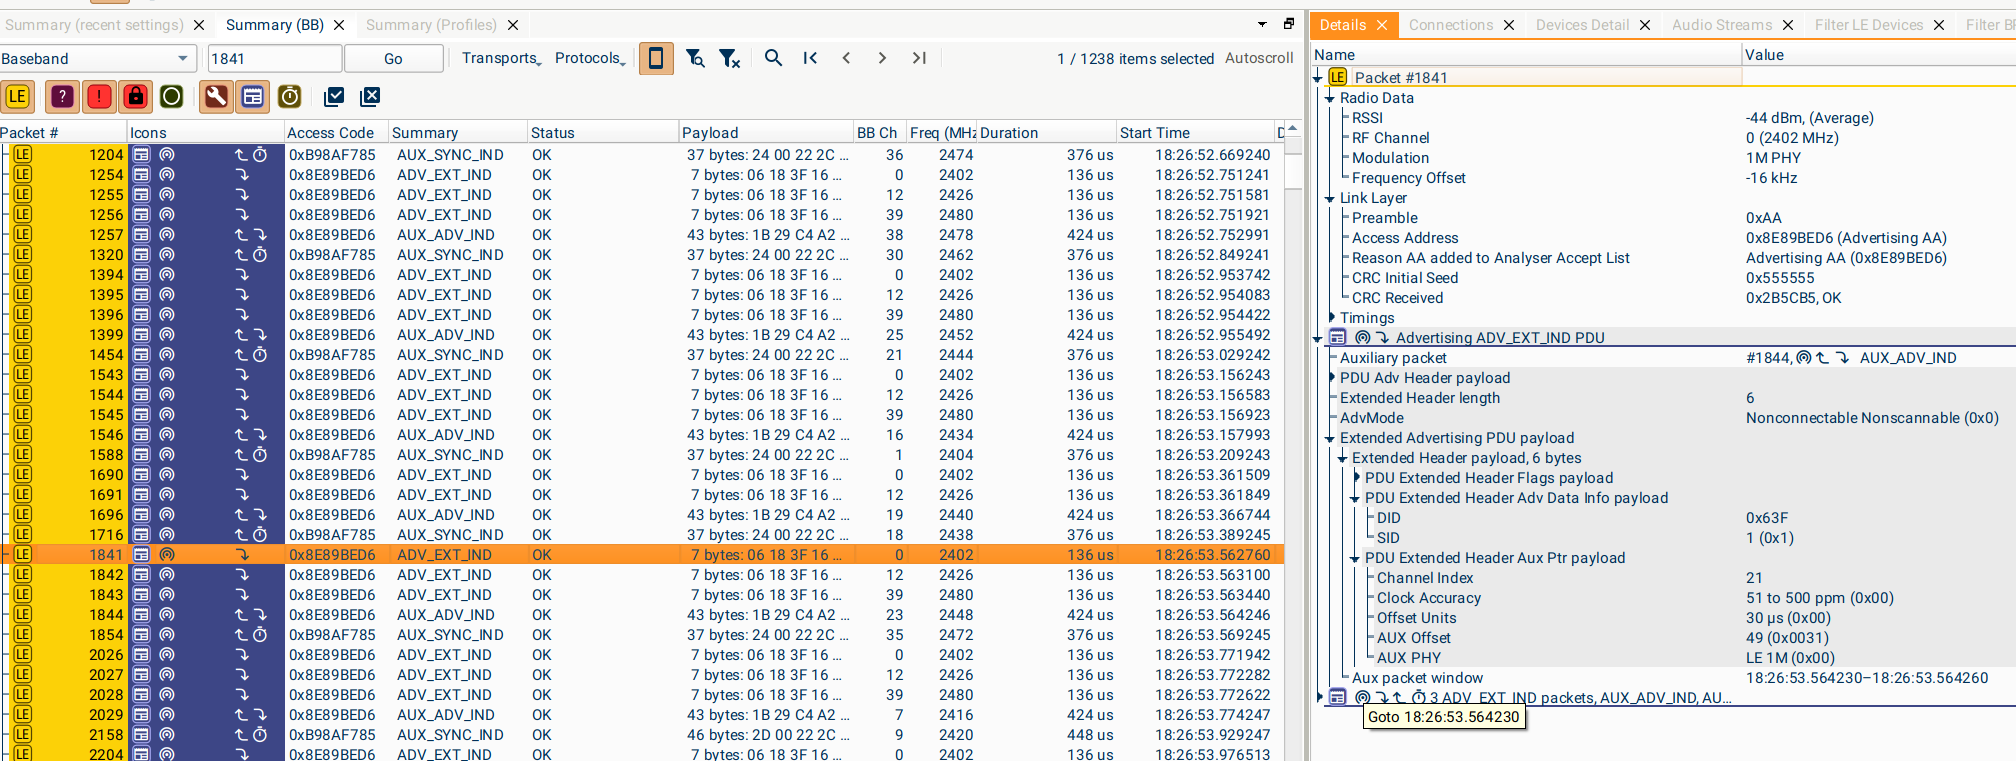
If a baseband packet or a timestamp is referenced in the Details, Connections, or Devices tabs, double-clicking on the text will navigate to that packet (or to the first of that set of packets) in the Summary tab. For example, double-clicking on the "Aux packet window" field in this extended advertising packet will Goto 18:26:53.564230, and select packet #1841 which falls in that window.
Specific Views for different Protocol layers
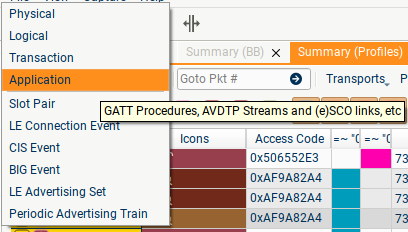
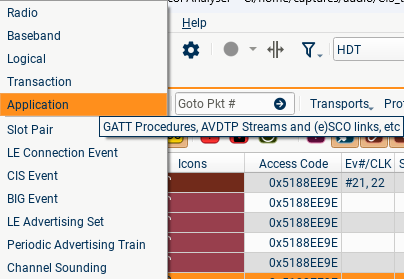
Several different Views are available in the Summary window, displaying different protocols and different types of event. Some of the Views are most useful for studying timing and NACKs/ReTXes in the lower layers, whereas others are better for following the flow of data in higher-level protocols.
The first four Views organise packets at increasing levels of abstraction/aggregation, collecting together packets that are part of e.g. a single L2CAP packet, a single Transaction involving multiple L2CAP packets, or a procedure consisting of a sequence of Transactions.
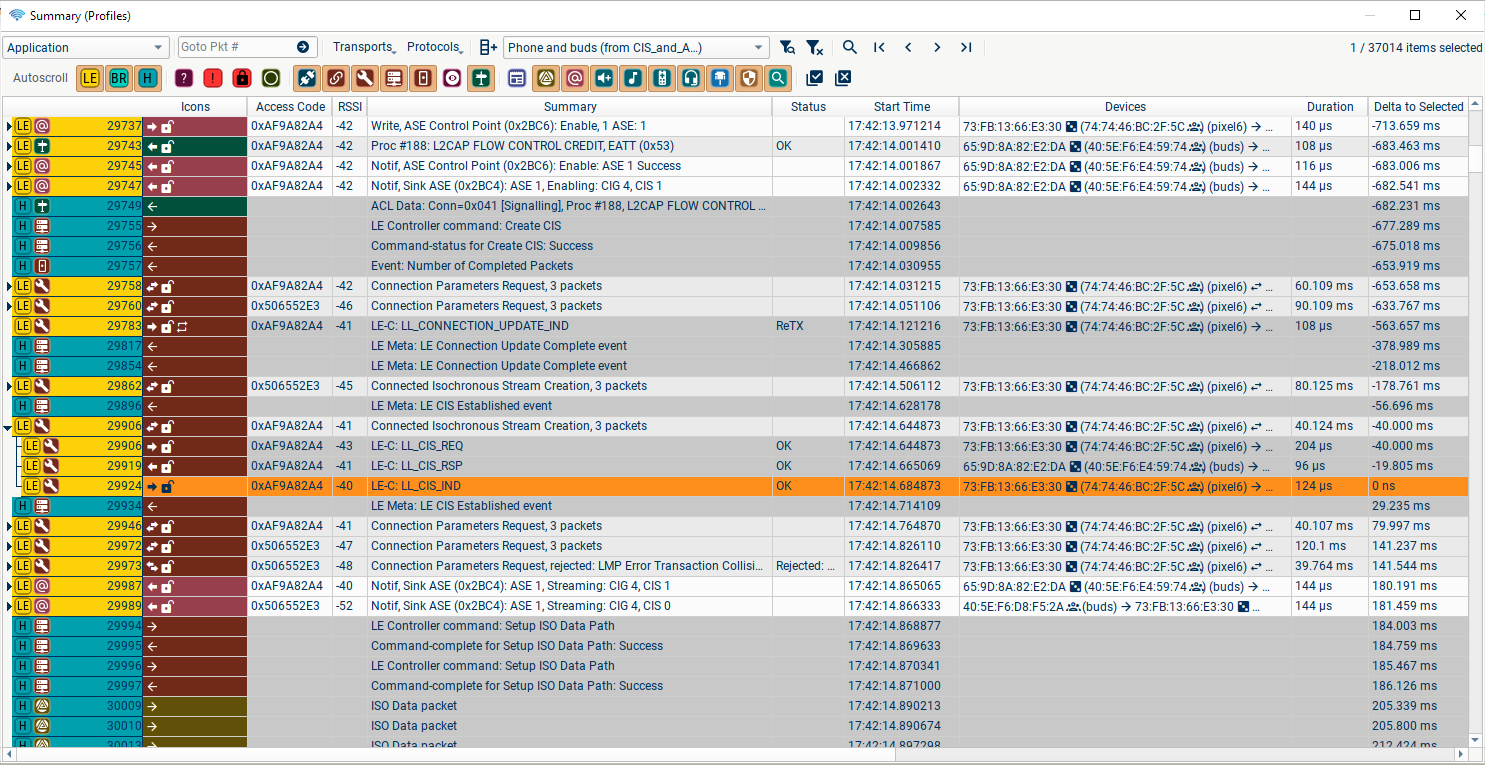
The screenshot above shows how the "Application" View displays a GATT Procedure; in this view, up to 3 levels of aggregation are used. The Procedure consists of seven READ_BY_GROUP_TYPE ATT Transactions, each of which contains two L2CAP packets, each of which is sent in a single LL packet.
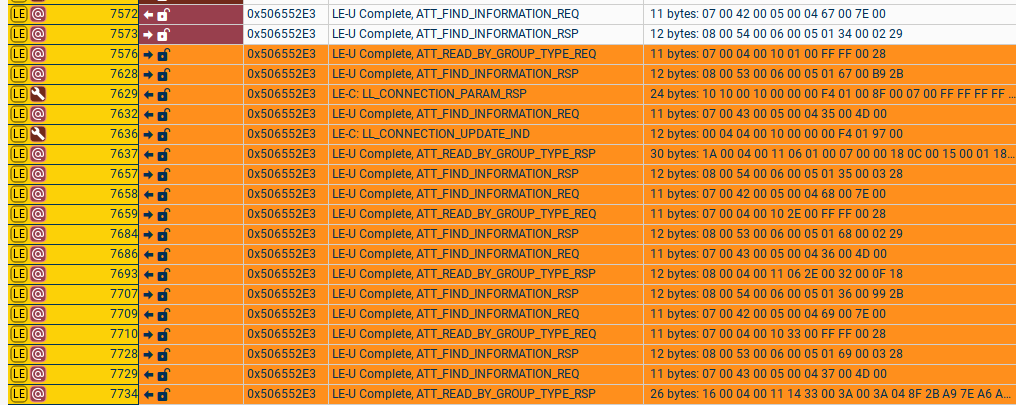
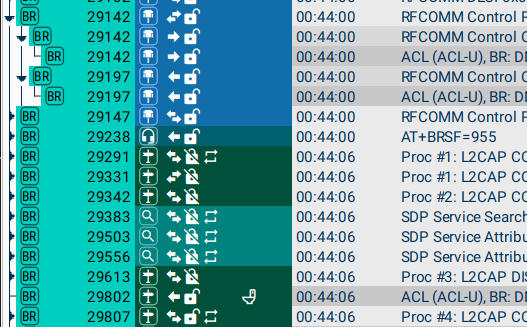
Viewing the same procedure in the "Baseband" View shows the LE LL layer packets in sequence (Empty packets have been hidden here); here we can see that another GATT procedure (using the ATT_FIND_INFORMATION... packets) and some LL Control packets are mixed in with this procedure.
The "Logical" and "Transaction" Views use intermediate levels of aggregation; the first collects together segmented packets (e.g. a complete L2CAP PDU), and the second collects together sets of these packets.
The "Baseband" and "Radio" Views in most cases show the same sequences of packets, but with different interpretations. The "Baseband" view shows a summary of the higher-layer interpretation of the packets (e.g. for packets which are part of an L2CAP SDU, the packet is interpreted according to the relevant protocol configured on that L2CAP channel); the "Radio" view omits this interpretation and simply shows the bytes in each ACL Data packet. This can be useful when testing a controller to avoid blueSPY presenting confusing interpretations of arbitrary bytes sent in ACL Data packets.
The "Baseband" and "Radio" Views are distinct in a more important way when looking at HDT traffic. The "Radio" View shows individual HDT Packets in sequence, while the "Baseband" View shows reconstructed HDT Payloads.
The four Views showing BR/EDR Slot Pairs, LE Connection Events, CIS and BIG Events display limited information about the content of the packets sent, and instead focus on the timings of events, and any missing packets/NACKs/ReTXes.
The LE Advertising Sets View collects together Advertising Events sent by one device at regular intervals. The lower events in this View are usually substantially out of order, as Advertising Sets will often overlap and can be very long.
The Periodic Advertising Train View shows only periodic advertising packets, and not the legacy/extended packets pointing to them. This is particularly useful for analysing Periodic Advertising with Responses, where the View shows the PAwR Events and Subevents.
If no packets are shown when a View is selected, check that there are no Filters/Searches hiding the relevant packets. For example, displaying only BR/EDR packets while on the LE Connection Events View will result in a blank screen!